HOME > Japan SPOTLIGHT > Article
White Paper on International Economy & Trade 2018 — Summary (Part 1)
By Policy Planning & Research Office, Trade Policy Bureau, Ministry of Economy, Trade & Industry (METI)
Introduction
The global economy is now facing significant shifts — for example, movements against the free trade system under the WTO; advancement of digital transformation including expanding digital trade; and the rise of China and other emerging and developing economies. The White Paper 2017 focused on the first shift mentioned above to analyze the issues surrounding inequality in developed economies and relationships between trade and inequality. The White Paper 2018 focuses on the remaining two shifts.
First, the White Paper presents the current state of the expanding global digital trade and reveals the issues that come with digital trade. It also analyzes the characteristics of the economic growth in emerging and developing economies and the issues that accompany them. It goes on to provide a multifaceted analysis of the Chinese economy, whose rapid growth and changes are notable even among emerging and developing economies. One of the matters that the analysis covers is the business opportunities in the growing Chinese consumer market.
The objective of the analysis is to demonstrate the necessity of constructing liberal, fair, and high-level trade rules and making further efforts to revitalize domestic industries.
1. Expanding Digital Trade
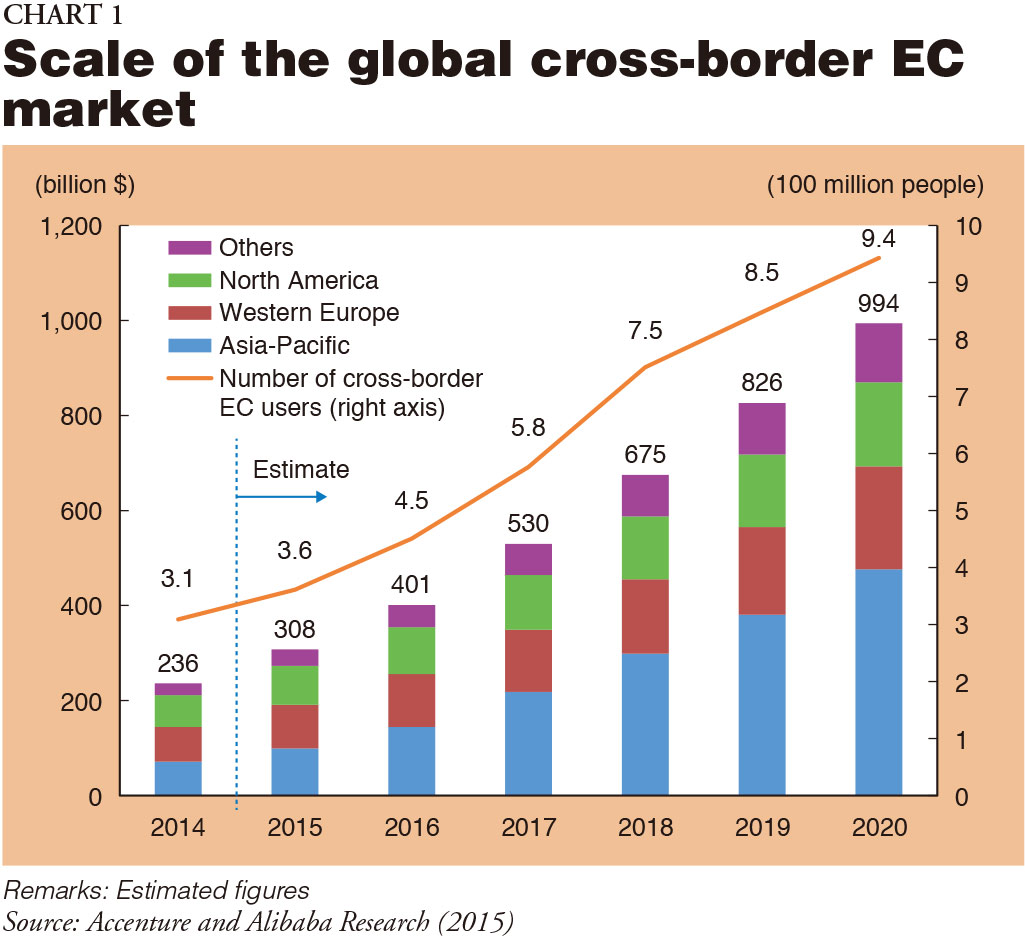
The amount of data being traded worldwide is growing at a phenomenal pace as a consequence of the progress of the Fourth Industrial Revolution. The speed with which the data are being processed is also rising dramatically. The Internet and mobile telephony have spread to all corners of the world including emerging economies, and the digital market is growing rapidly.
The scale of the global cross-border e-commerce (EC) market was $236.0 billion in 2014. It has continued to expand since then and is expected to reach $994.0 billion in 2020. The number of cross-border EC users, which was around 300 million people in 2014, is expected to approximately triple to 900 million people in 2020 (Chart 1). The causes of the expansion of the global EC market include the growing use of personal computers and cellphones to conduct transactions and the diversification of online means of settlement.
In line with the expansion of digital trade, the presence of global companies that provide IT platforms for EC and cloud computing services is increasing.
In 2008, telecommunications companies made the top 10 [market capitalization] rankings alongside oil, gas and other resource companies and banks.
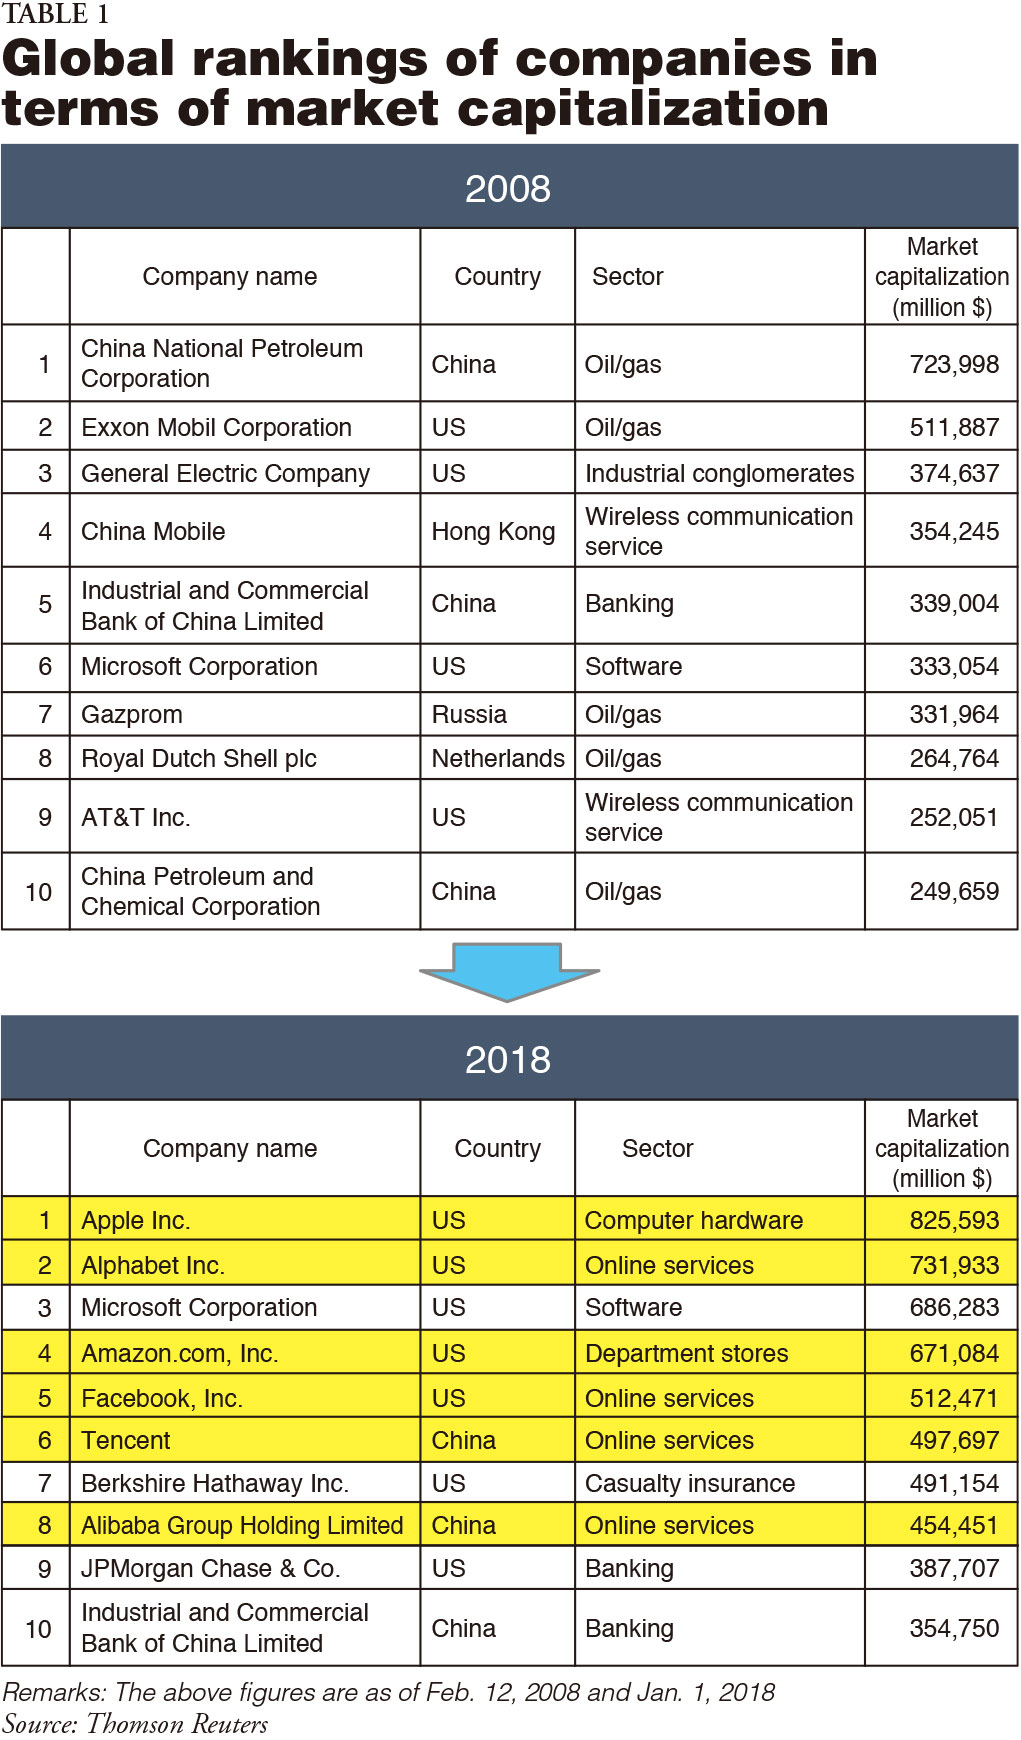
Ten years later, as of January 2018, US and Chinese IT platform companies led by Apple and including Alphabet (Google), Amazon, Facebook, Tencent, and Alibaba made the list (Table 1).
In 2008, businesses providing telecommunication infrastructure tended to be highly valued in terms of market capitalization against the backdrop of a marked rise in the diffusion rate of mobile phones.
In the 21st century, a wide variety of IT platform companies are playing leading roles, contributing to social and economic development through technological innovation and lower transaction costs.
With the progress in digital trade comes an increased need for the development of international rules. The free flow of information is developing a favorable cycle that is creating new technical innovations and business models and improving the quality of people's lives. On the other hand, cybersecurity concerns such as the leakage of personal information and confidential corporate data are also growing with the rise in various activities in cyberspace. Digital protectionist moves are also emerging, including imposing restrictions on the free flow of cross-border data and the installation locations of servers. National restrictions on cross-border data flow have grown rapidly over the last 20 years (Table 2).
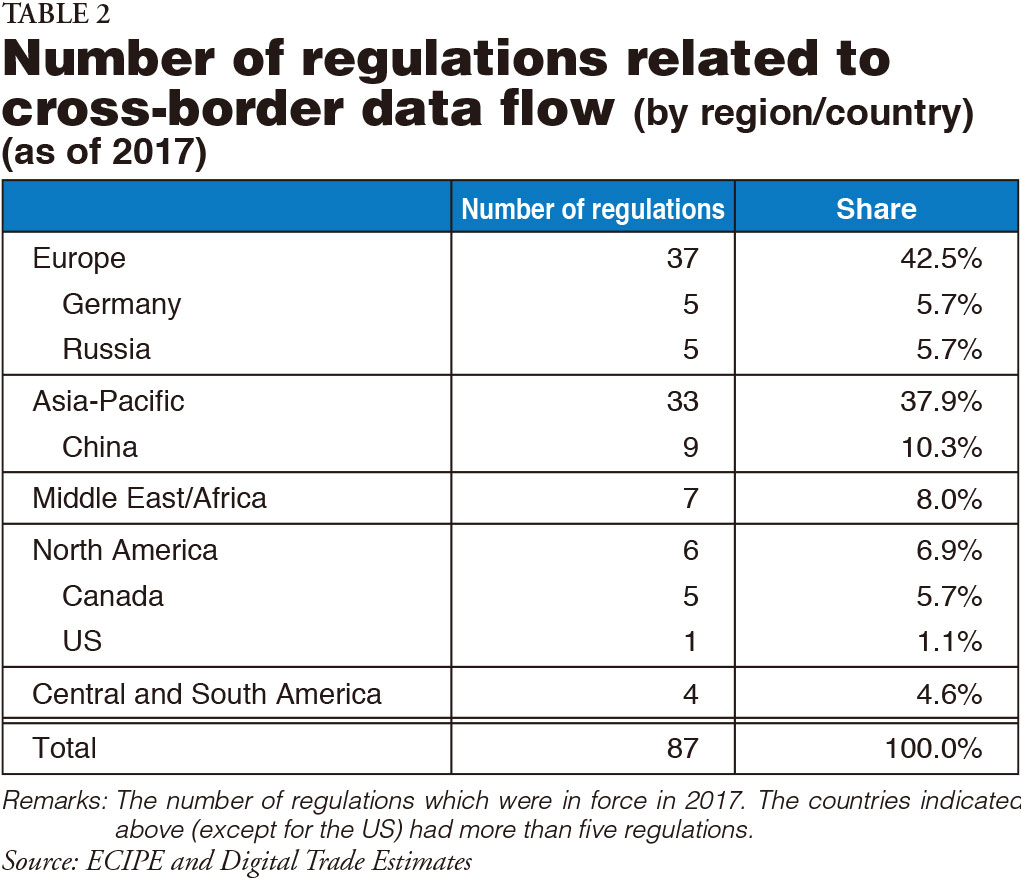
If a country introduces cross-sectoral data localization regulation, its GDP is estimated to suffer a negative impact ranging from -0.7% to -1.7% due to such factors as a domestic price increase and a productivity decline caused by an increase in the usage cost of data processing services.
Other challenges include securing the conditions for fair competition between IT platform companies and existing industries and ensuring the protection and safety of consumers.
2. Rise of Emerging and Developing Economies
Next, the White Paper looks at economic growth in emerging and developing economies.
Concerning the contributions to the real growth rate of global GDP by country and region, the contribution by advanced countries to the real growth rate of global GDP has been declining since around 2000, while the contribution by emerging and developing countries, including China, has been increasing (Chart 2).
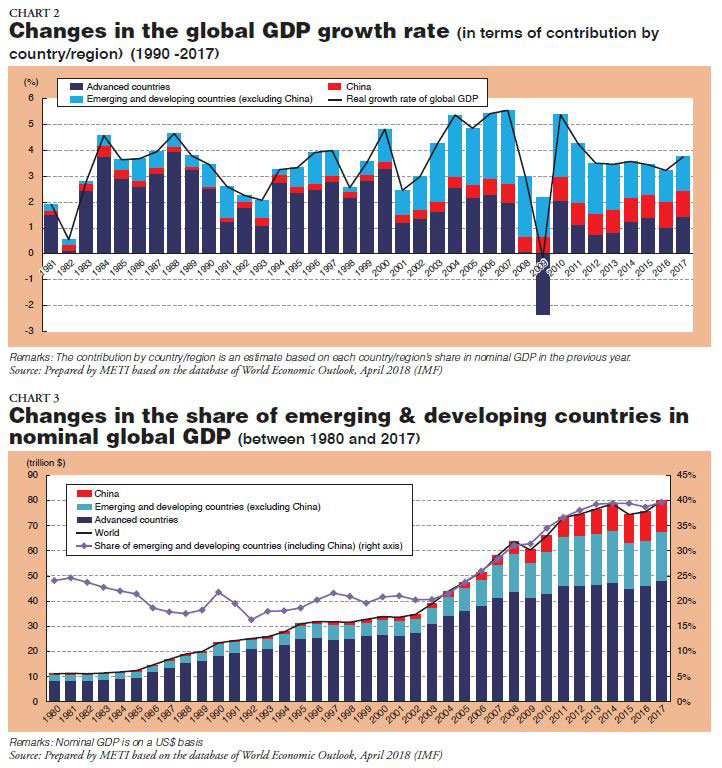
Nominal global GDP has been growing steadily despite temporary drops due to the Great Recession, among other factos. The share of emerging and developing countries in nominal global GDP has been increasing since the middle of the 2000s and has recently surpassed 40% (Chart 3). In terms of the contribution to global economic growth, the role of emerging and developing economies is growing ever greater.
Characterizing the economic growth of emerging and developing economies is the growth of domestic investment at a pace outstripping that of consumption. Fixed capital formation accelerated in emerging and developing economies around 2003 and reached $9.5 trillion in 2016, almost the same value as in developed economies, but consumption remains at around 60% of developed economies (Chart 4).
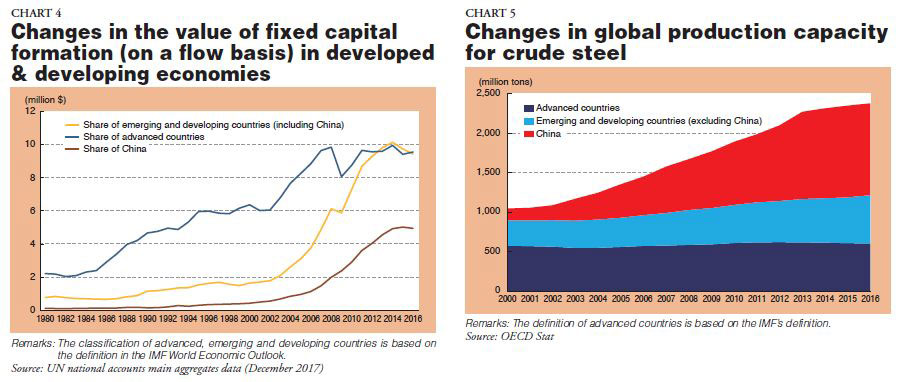
Emerging and developing economies' capacity has continued to grow in their raw materials industries to keep pace with the growth in their fixed capital formation. The 2000s were a period in which investment played a major role in raising the economic growth rate in emerging and developing economies, since it was during this period that much infrastructure development and corporate investment in production equipment took place. For example, while production capacity for crude steel has stayed at around 600 million tons in developed economies over the last 17 years, capacity in emerging and developing economies as a whole has continued to grow. In 2017, global production capacity increased to 2,300 million tons, around 2.3 times as large as the capacity in 2000. Among emerging and developing economies, China has increased its production capacity markedly (Chart 5).
Taking the steel industry in China as an example of the excess production capacity in emerging and developing economies, the process can be broadly divided into the following three stages. (i) As banks increased low-interest loans and steel companies expanded production capacity, the return on assets (ROA) rose from 7% in 2001 to 14% in 2004. (ii) Since 2006, China has recorded steel export surpluses, but loans and production capacity expansion have continued. From 2008 onward, the ROA for steel companies stayed below 5%. (iii) In February 2016, the central government set a target for the production of production equipment and strictly managed the implementation of the target. As a result, the target was achieved in 2016 and 2017 (Chart 6).
Financing for steel companies and investment in their production equipment as well as the government subsidies and other support in the face of the poor business results beginning in 2012 were focused on state-owned companies under the jurisdiction of local governments. When the steel companies are categorized into three groups — "state-owned companies owned/controlled by the central government", "state-owned companies owned/controlled by local governments" and "private companies" — in looking at the amounts of long-term debt outstanding and government subsidies, it can be seen that much is directed at state-owned companies owned/controlled by the local governments.
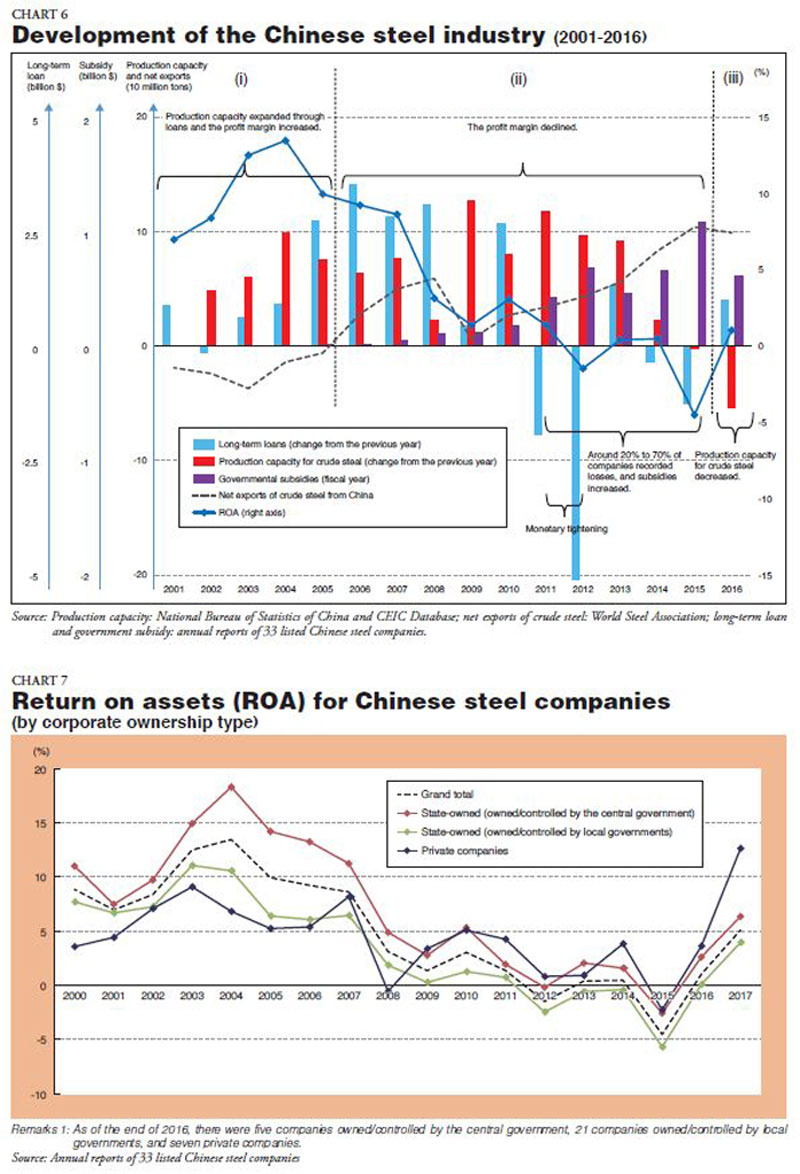
However, this has not necessarily contributed to enhancing profitability and value-added in those companies. State-owned companies owned/controlled by local governments in particular continue to trail the other companies in the rate of return on total assets. Management has yet to be improved in these companies (Chart 7).
Sharp increases in capital investment through governmental support in China are also seen in the integrated circuit industry. There is a risk that an excess production capacity problem in the industry may occur in the future.
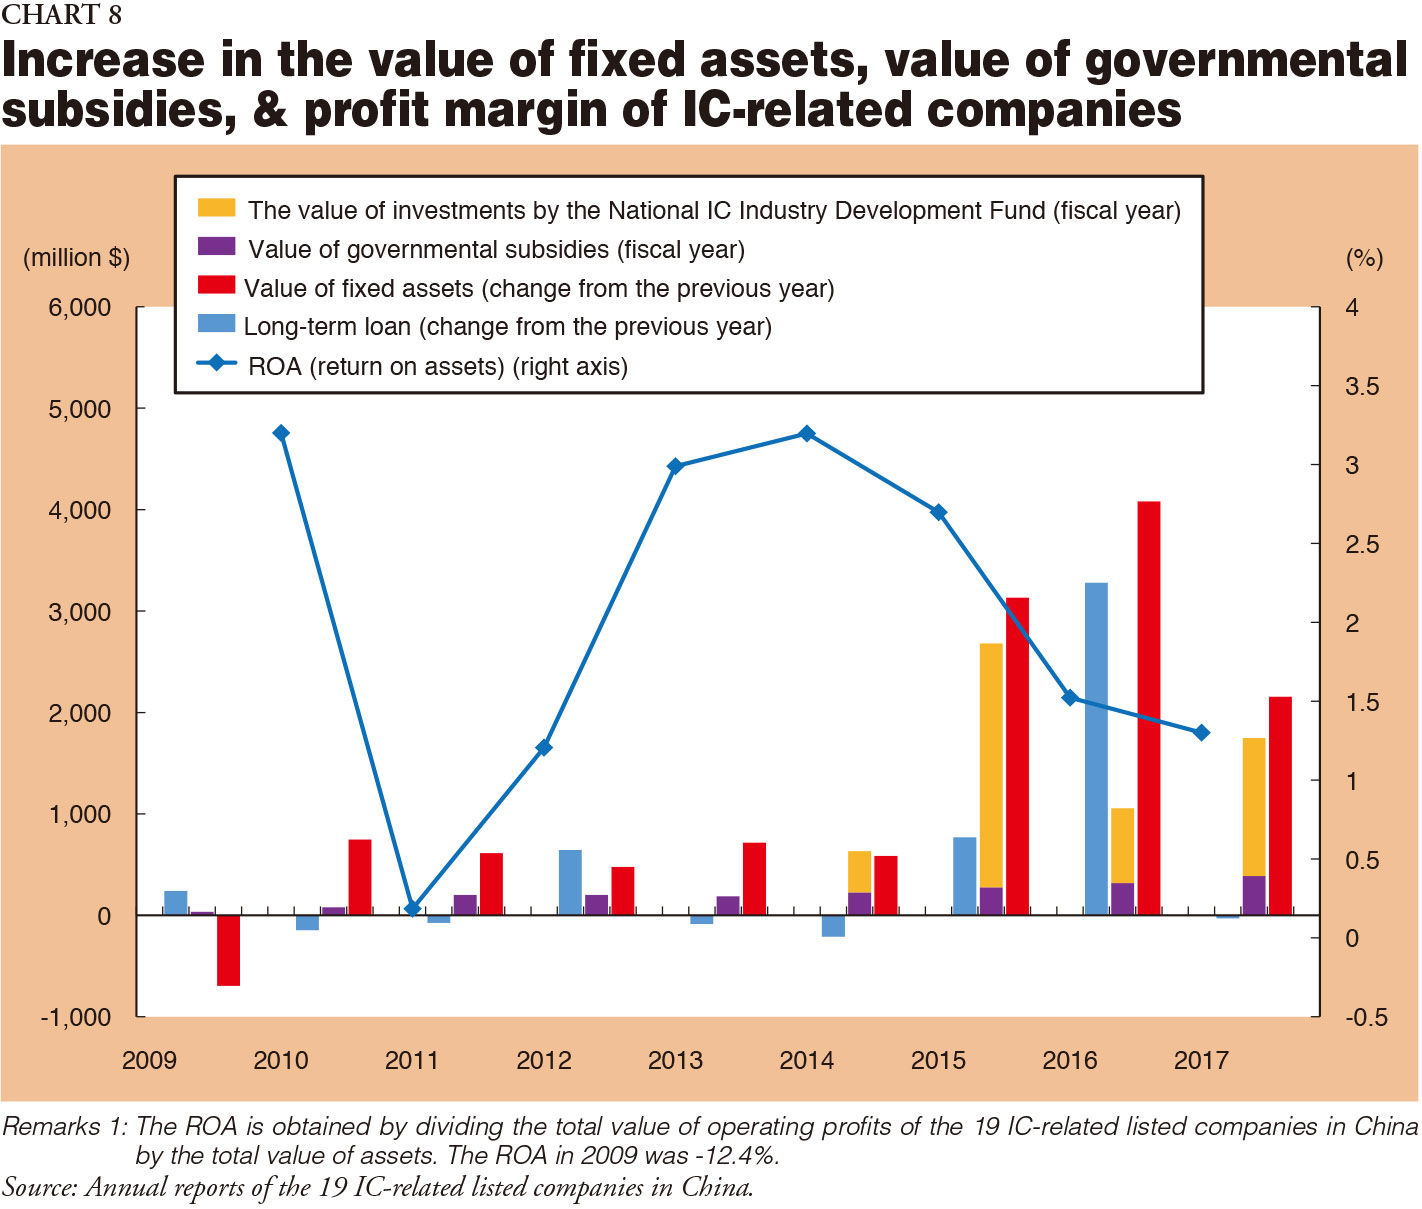
In 2014, the Chinese government formulated the "National Integrated Circuit (IC) Development Guidelines". Under the Guidelines, a national investment fund (National Integrated Circuit Industry Investment Fund) was established that made approximately $4 billion worth of investments per year in integrated circuit-related companies. As a result, investment from the investment fund and other policy resources in addition to government subsidies and corporate debt increased rapidly from 2014, resulting in a dramatic rise in fixed assets between 2015 and 2017. Meanwhile, the rate of ROA has been declining for these businesses during this same period. This trend in the Chinese IC industry is similar to the situation of the Chinese steel industry in the period of net import, so there are concerns that an excess production capacity problem may occur in the IC industry in the future (Chart 8).
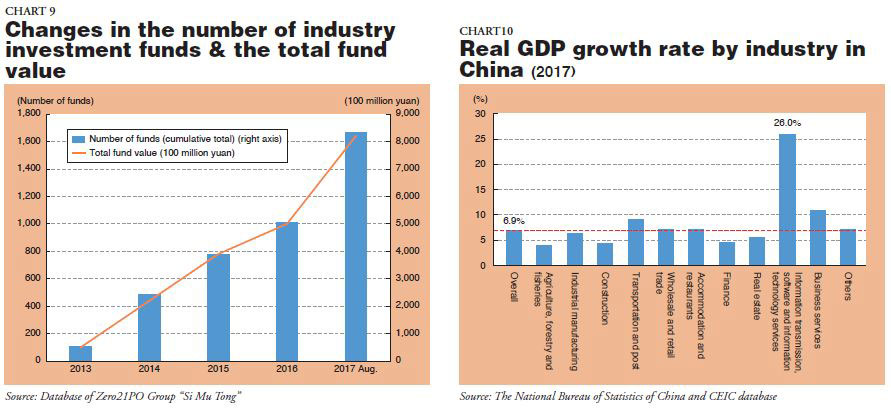
Industrial investment funds such as the National Integrated Circuit Industry Investment Fund have been playing a particularly prominent role in recent years as policy resources. The number and total value of these funds have been growing rapidly since 2014 and are currently increasing their presence as the main source of China's policy resources today(Chart 9).
3. Rapid Changes in the Chinese Economy
(1) Advance of New Industries
Looking at China's GDP from the demand side, export and gross capital formation reduced their shares after the 2008 financial crisis and the 4 trillion-yuan stimulus package respectively, while private consumption has been gradually increasing its share. A decomposition analysis of GDP in real terms shows that the contribution from investment is declining and consumption has become the pillar of economic growth. In that sense, China is gradually shifting from investment-led growth to consumption-led growth.
A look at the real GDP growth rate by industry in China in 2017 shows that the information transmission, software and information technology services industry recorded an outstandingly high growth rate of 26.0% (Chart 10).
Chinese Internet users, on whom these services are based, are increasing in number year by year. They increased almost fourfold from 210 million to 770 million in 10 years with the penetration rate reaching 55.8% by the end of 2017. Users on mobile devices increased more than 10-fold from 50 million to 750 million. More than half the Chinese population are now able to access services freely on the Internet wherever they are.
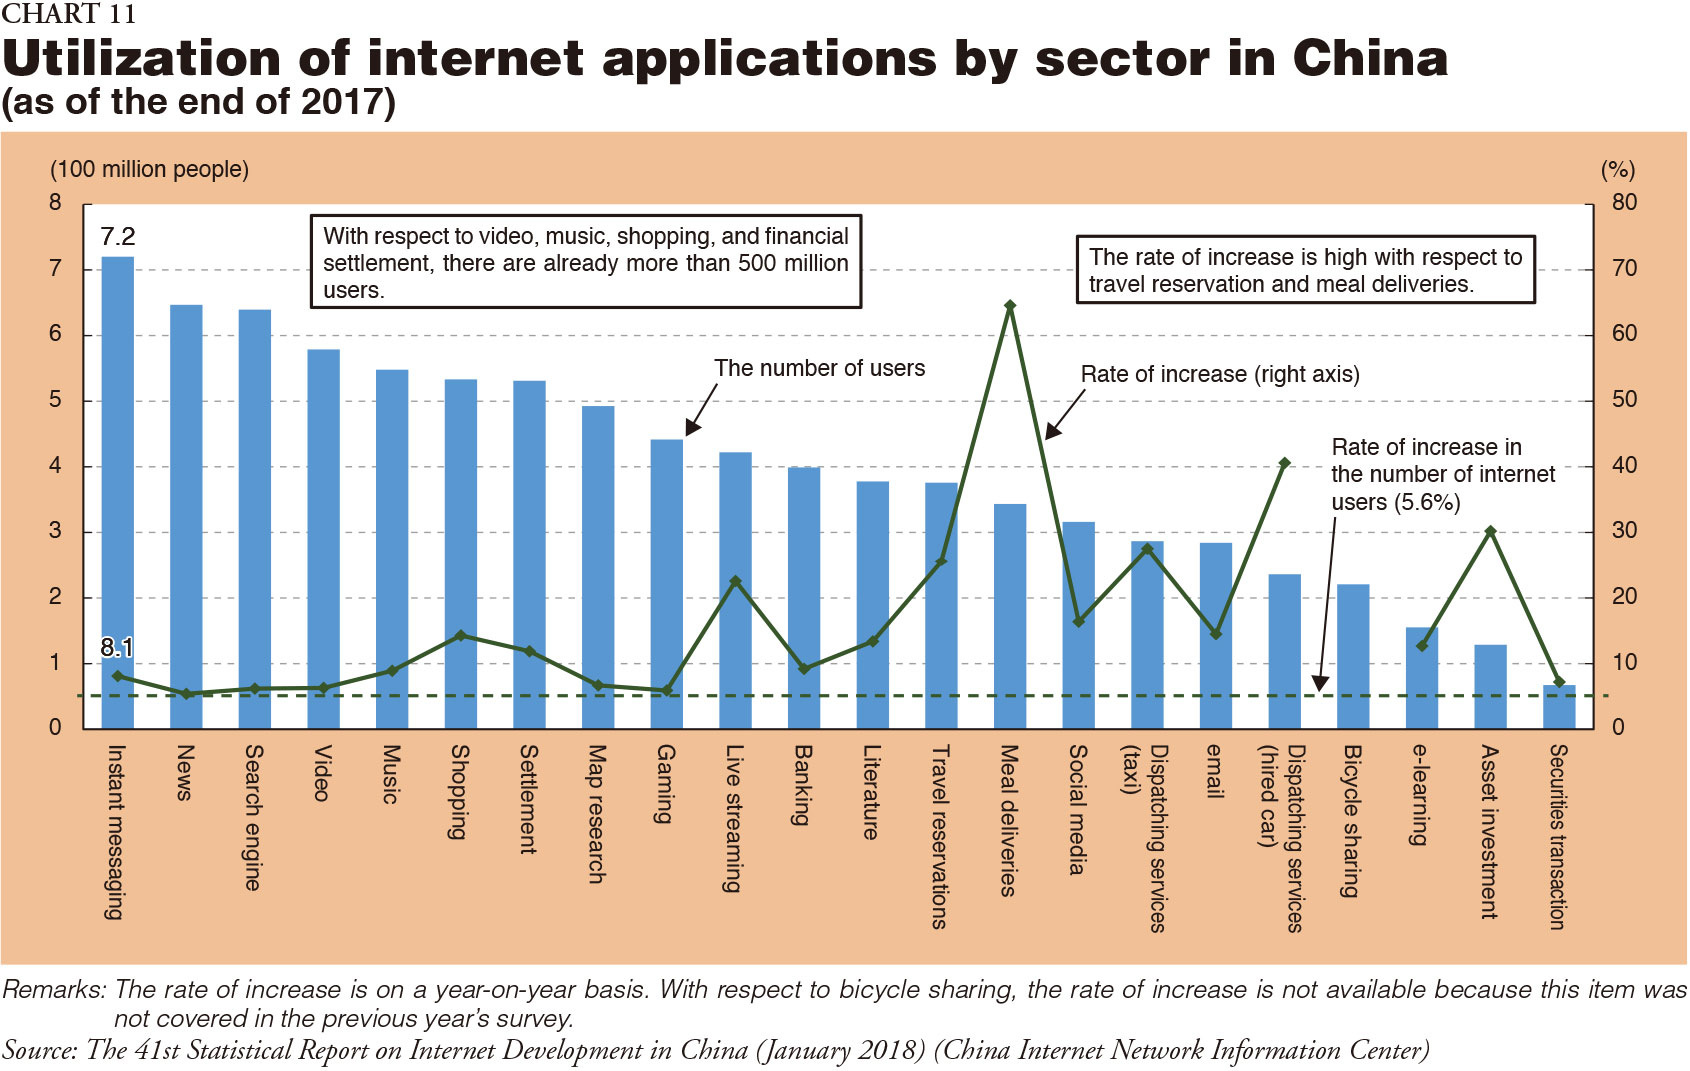
As Internet use expands in China, the EC market is also growing significantly. China boasts the world's largest scale of EC sales at approximately 23 trillion yuan (3.4 trillion yen) in 2016. Internet services for consumers cover a wide range of areas. Among Internet applications, instant messaging, search engines, videos, music, shopping, and online payments are popular, with more than 500 million estimated users each. The number of users for travel reservations, meal deliveries, car dispatching services, and financial services is growing at a high rate, indicating that the market is expanding rapidly (Chart 11).
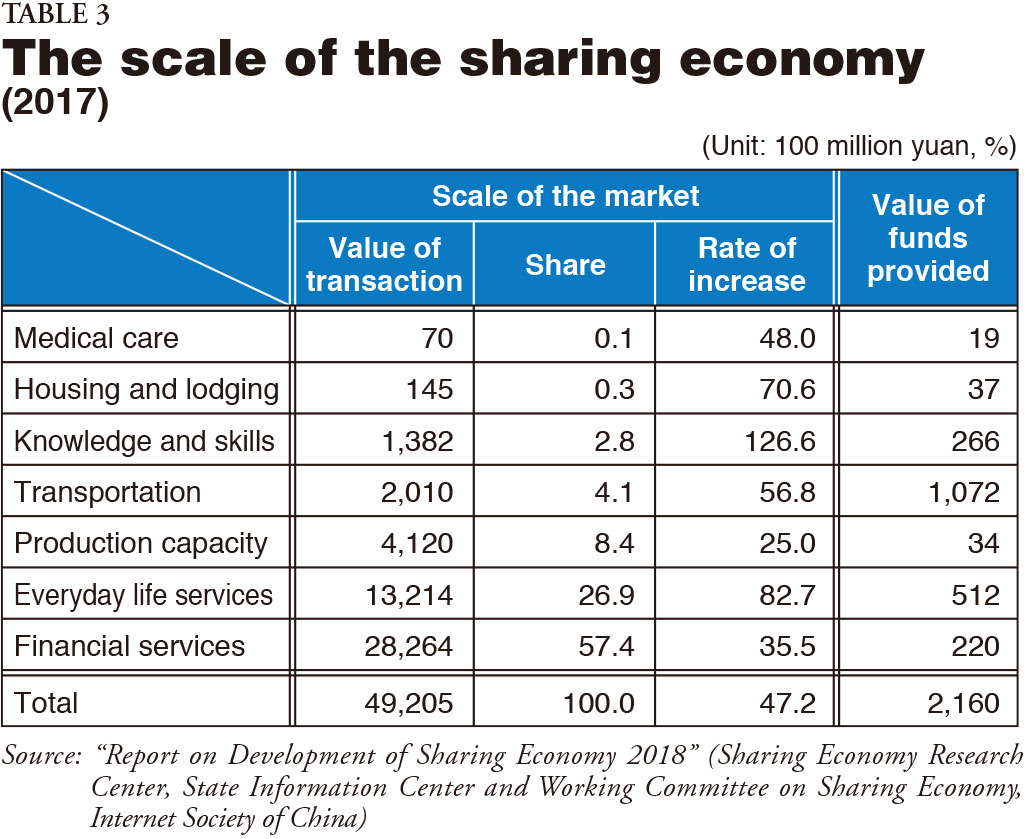
The sharing economy has also emerged as a new economic activity conducted via the Internet. The sharing economy is defined as an economic activity that utilizes resources efficiently by sharing vehicles, dwellings, funds, etc. by using the Internet and other technology. The market size in 2017 stood at approximately 4.9 trillion yuan, a 47% increase over the previous year. By transaction value by sector, the transaction value of financial services, including online financial services, amounts to around 2.8 trillion yuan, accounting for more than half of the total. The total value of funds provided for new market entry and business expansion in all sectors grew 25.7% from the previous year to 216.0 billion yuan (Table 3). Platform companies related to the sharing economy are contributing to employment growth by hiring more people. It has been pointed out that this is functioning not only as a gateway for new graduates but also as a safety valve for employment adjustments due to changes in the industrial structure such as the liquidation of companies that represent excess capacity.
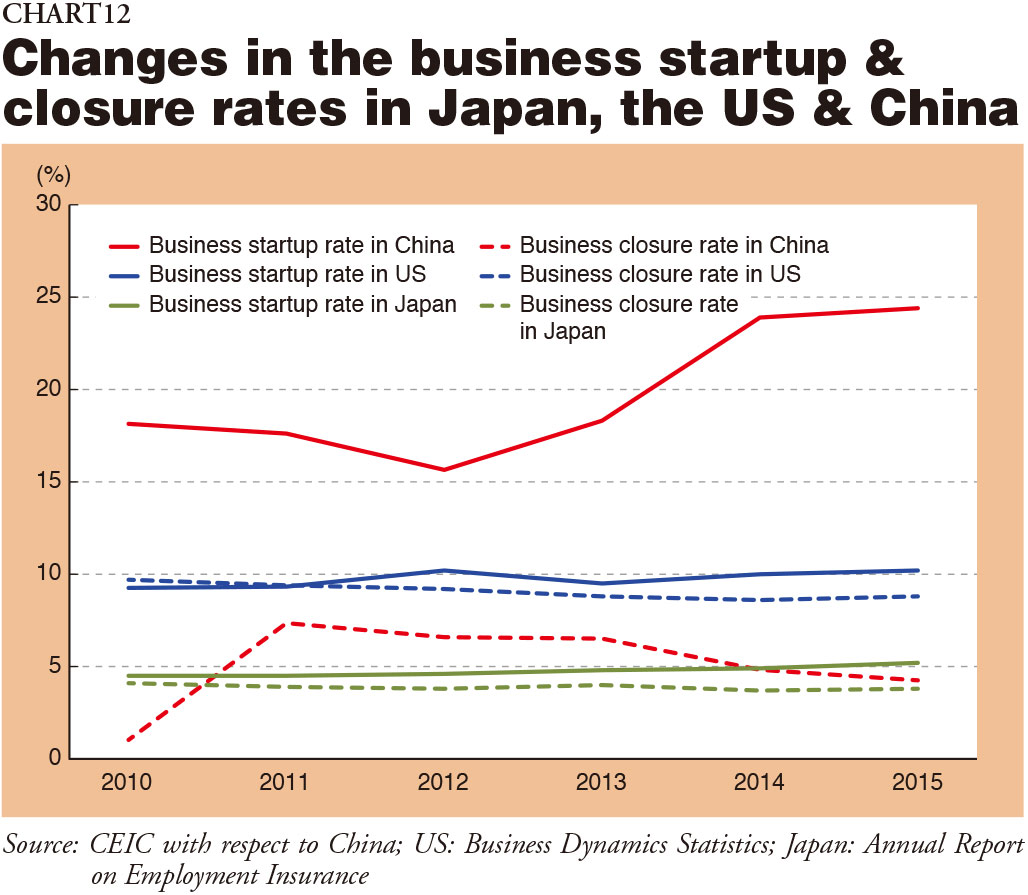
Let's take a look at business startups. Startup activity is even more lively in China than in the United States. Startups have been increasing at a rapid pace since around 2014 when "The Mass Entrepreneurship and Innovation" — the entrepreneurship support initiative promoted by the Chinese government — was announced. New companies registered in 2017 reached 6.07 million (19.25 million including unincorporated businesses). The ratio of new business openings in China is very high in comparison to the US and Japan, as the massive number of new registrations indicates (Chart 12). It has been noted that startups have been easy to do in China because taking on second jobs is widely accepted there. While the Chinese government is successively issuing policy measures to promote innovation, it is considered that one of the factors giving startups impetus is that it tends to initially give free rein to new industries and markets emerging from innovation and consider regulating them only after problems emerge in the marketplace. Car dispatch services are given as a prime example of this.
As for investment by venture funds in venture businesses, an important source of innovation, China, at 2.2 trillion yen, ranks second only to the US, at 7.5 trillion yen. China provides a very favorable environment for entrepreneurs. Moreover, in 2012, the National Equities Exchange and Quotations, nicknamed "The New Third Board", was established as a "new third market" in addition to the Shanghai Security Exchange and the Shenzhen Stock Exchange to promote the development of venture businesses and the like. Since then, the number of companies listed on The New Third Board has increased dramatically, growing 37-fold between 2013 and 2017 to more than 11,000 companies as of the end of 2017 with a market cap of 4.9 trillion yuan (81 trillion yen).
Next, the White Paper takes a look at Chinese innovation capacity/capability through international patents. The number of China's applications for international patents has grown virtually every year since its accession to the Patent Cooperation Treaty (PCT) in 1994. In 2000, China was 16th in the number of international patent applications at 782. However, China surpassed South Korea in 2010, Germany in 2013, and Japan in 2017, placing it in second place after the US. A look at the proportion of international patent applications shows that the US alone accounted for 40% in 2000, but had dropped to 23.3% in 2013, with China soaring to 20.1%. This indicates that China has become one of the most active places of innovation in the world.
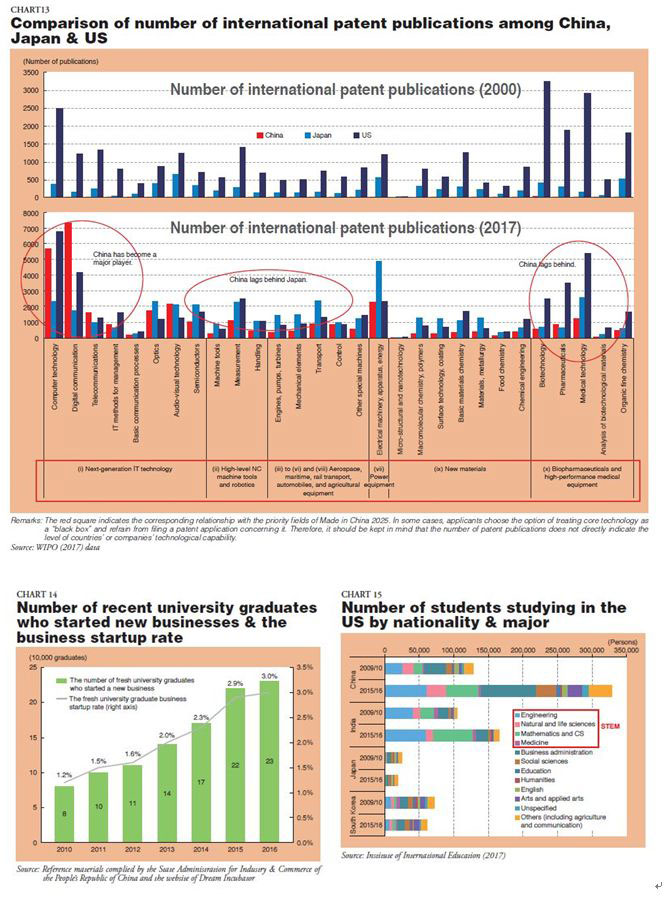
Next, a look at the number of international patent publications in the 10 key sectors in "Made in China 2025" reveals areas related to IT technology where China not only stands shoulder to shoulder with major economies worldwide but actually takes the lead, such as in digital communication. Meanwhile, China lags behind the US in biotechnology and healthcare and Japan in robotics and other machinery in the number of patent publications, indicating that China has been focused on specific fields in enhancing its technological prowess. However, China strives to enhance its competitiveness in key fields where it is currently at a disadvantage as a national priority. It is possible that other technologies will emerge rapidly in a manner similar to information-related technology (Chart 13). In some cases, applicants choose the option of treating core technology as a "black box" and refrain from filing a patent application concerning it. Therefore, it should be kept in mind that the number of patent publications does not directly indicate the level of countries' or companies' technological capability.
China stands out not only because of the large number of newly registered companies but also because of the numerous startups by new university graduates. Of the more than 7 million students who graduate annually from universities in China, around 200,000 start new businesses (Chart 14).
One factor behind the large number of patent applications, research papers, and unicorn companies being produced in China appears to be the supply of a large amount of sophisticated science and engineering talent. Nearly half of Chinese students studying in the US major in the STEM (science, technology, engineering and mathematics) fields. Of Chinese students studying in the US, 45.6% and 42.7% in 2009/10 and 2015/16 respectively majored in the STEM fields (Chart 15).
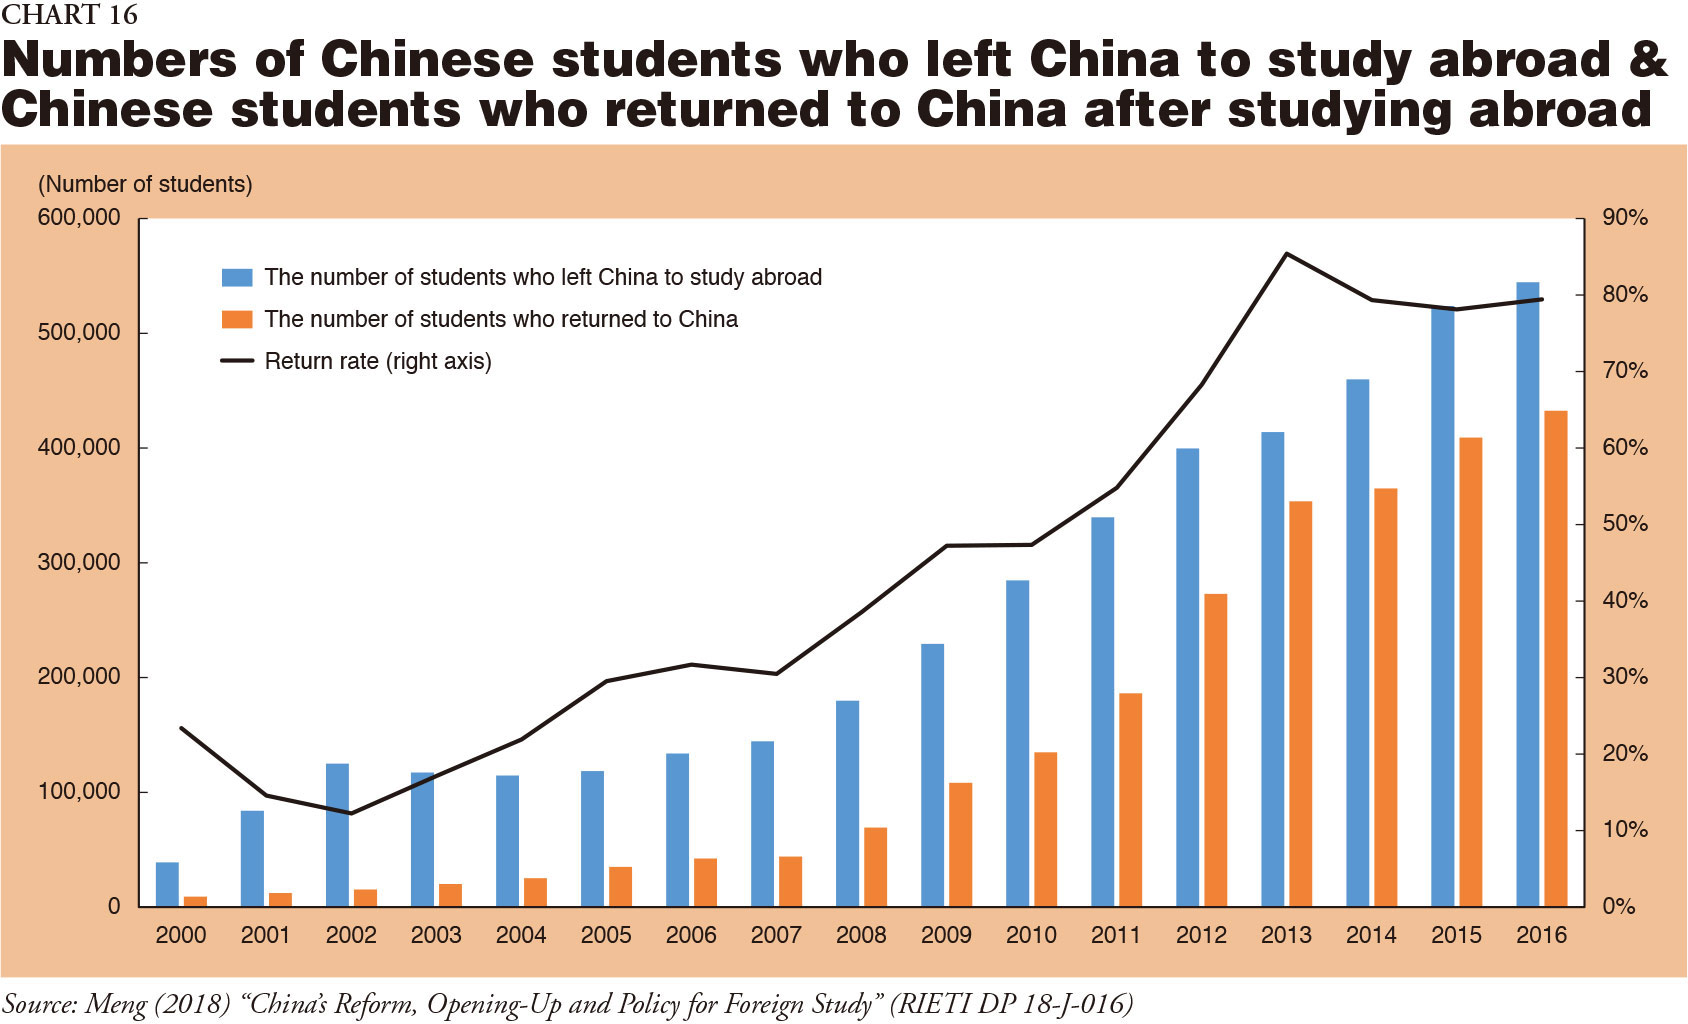
While the number of Chinese students studying abroad has kept rising since 2000, the return rate of students studying abroad to China remained low at less than 30% until 2008. However, the Chinese government put forth a series of measures to encourage students to return to China in order to secure high-level human resources from among the overseas students. As a result, the return rate rose rapidly, reaching 85% in 2013. The measures taken by the Chinese government to encourage return have made returnees an important source of human resources for innovation and entrepreneurship in China (Chart 16).
It is necessary to renew our understanding of the rapid changes in the Chinese economy — the rapid emergence of new industries, growing capacity for innovation, and fertile startup activities — and move forward with even greater initiatives to revitalize Japan's own domestic industries.
(to be continued)
Japan SPOTLIGHT September/October 2018 Issue (Published on September 10, 2018)
(2018/10/10)
Policy Planning & Research Office, Trade Policy Bureau, Ministry of Economy, Trade & Industry (METI)


Japan SPOTLIGHT

- Coffee Cultures of Japan & India
- 2025/01/27